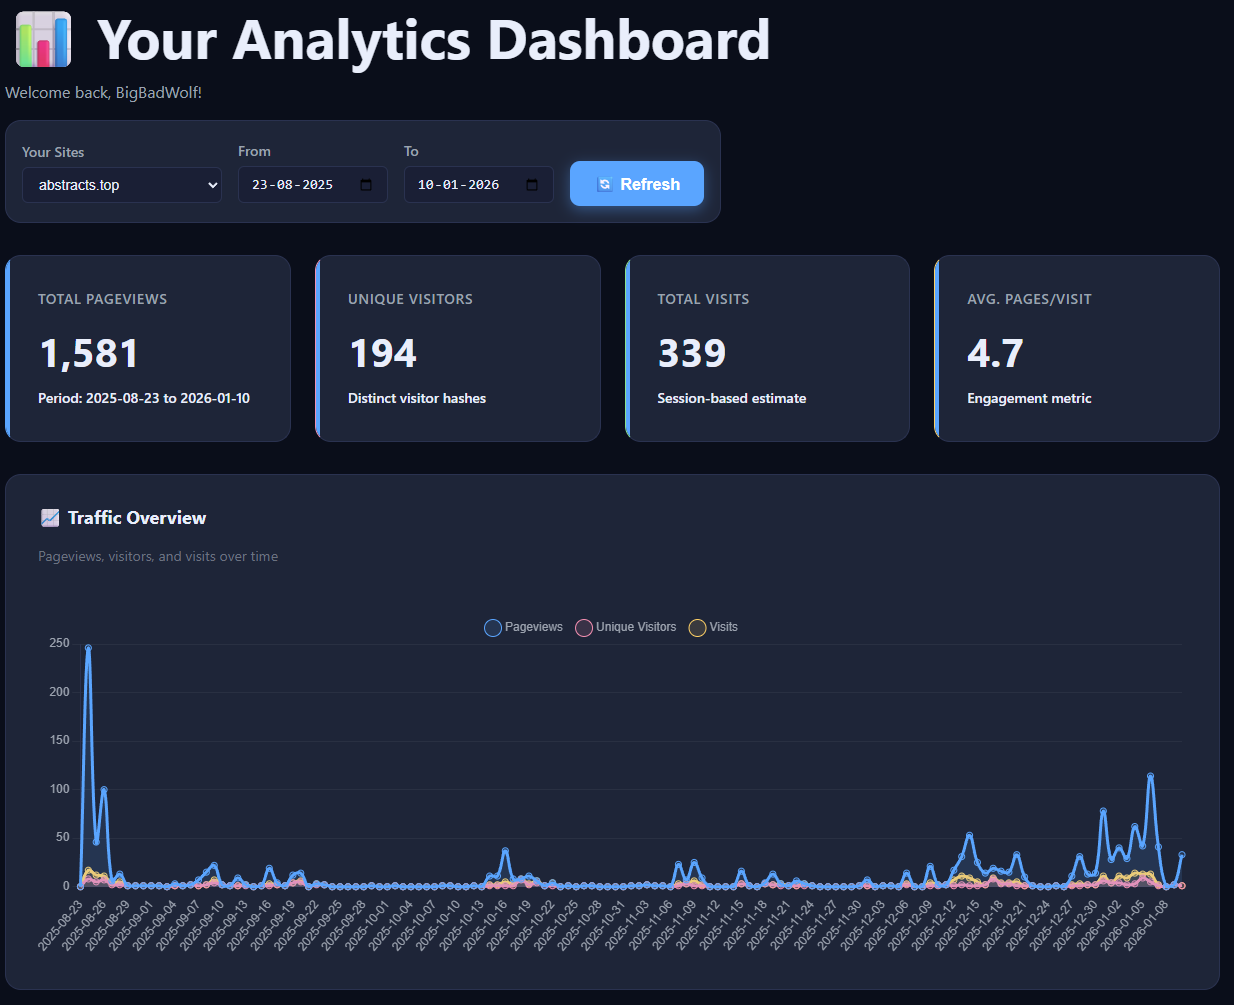
1) Date ranges & site selection
Select a site, pick any date range, and refresh the entire dashboard instantly. This makes it easy to compare campaigns, launches, and long-term trends with no sampling.
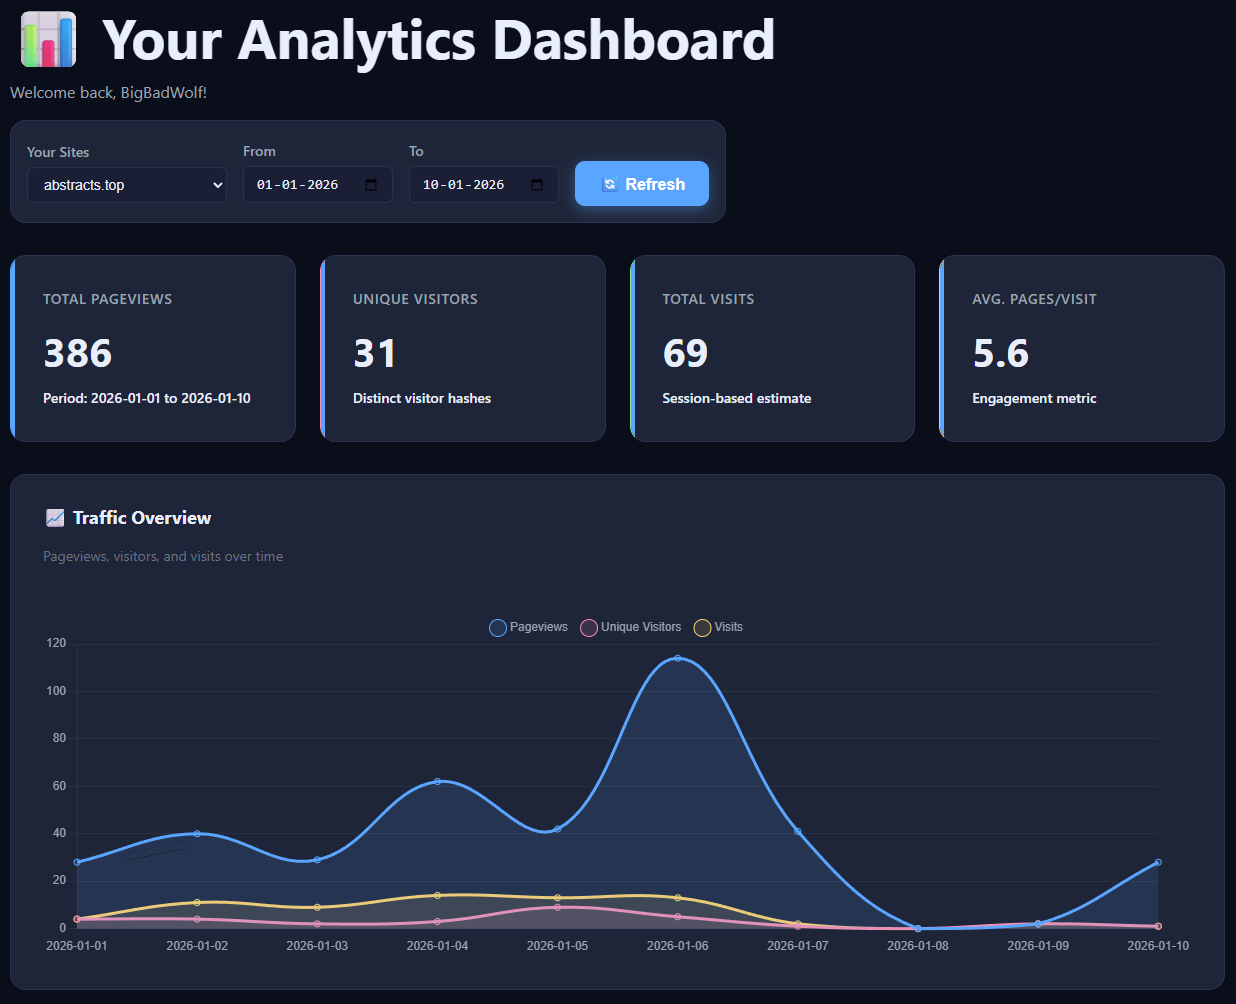
2) Core metrics
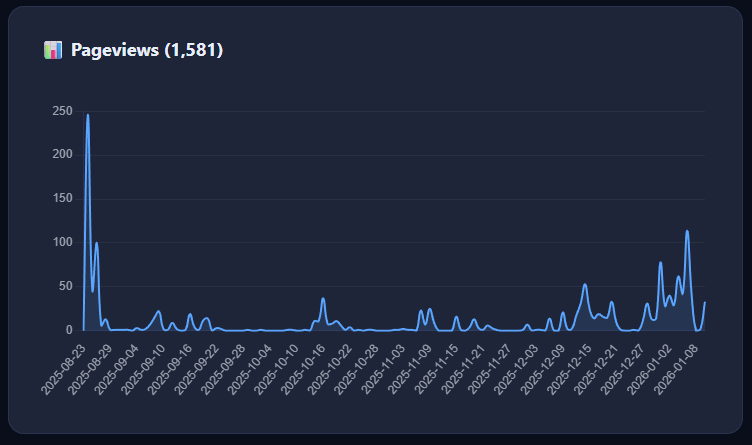
Pageviews
Each page load counts as 1 pageview. This is raw traffic volume.
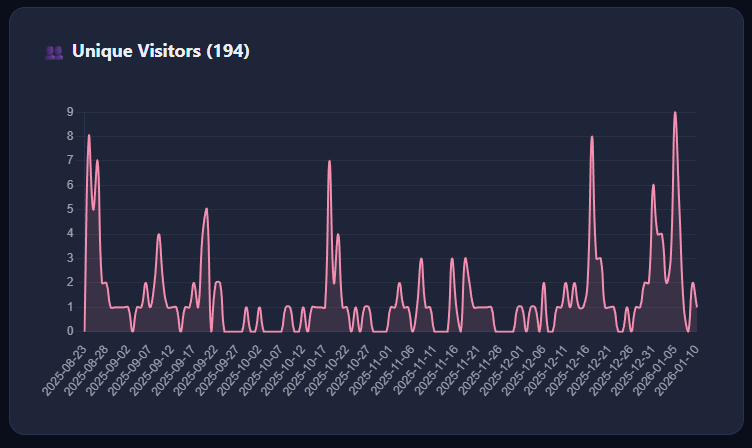
Unique visitors
Estimated via anonymous visitor hashes (no cookies). Gives realistic reach without identifying people.
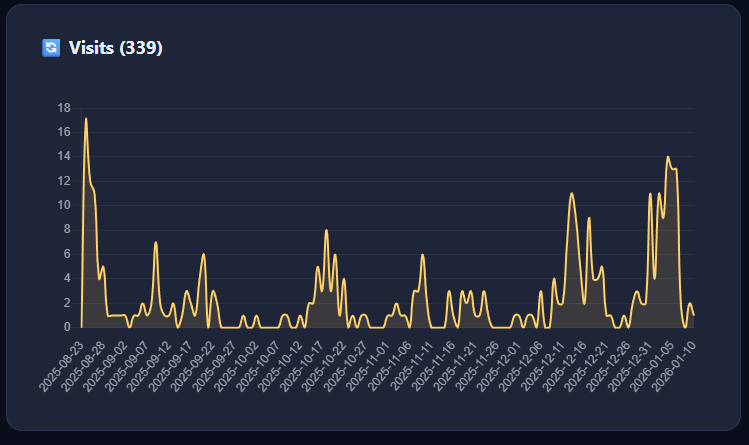
Visits (sessions)
A time-based session estimate that groups pageviews into visits — more useful than pure hit counts.
Avg. pages/visit
A simple engagement signal: are people bouncing or actually reading?
3) Traffic over time
The overview graph combines Pageviews, Unique Visitors, and Visits so you can spot spikes, drop-offs, and content that brings people back.
4) Historical view
Widen the time range to see real growth over months — without cookie-consent gaps or tracker blockers distorting your data.
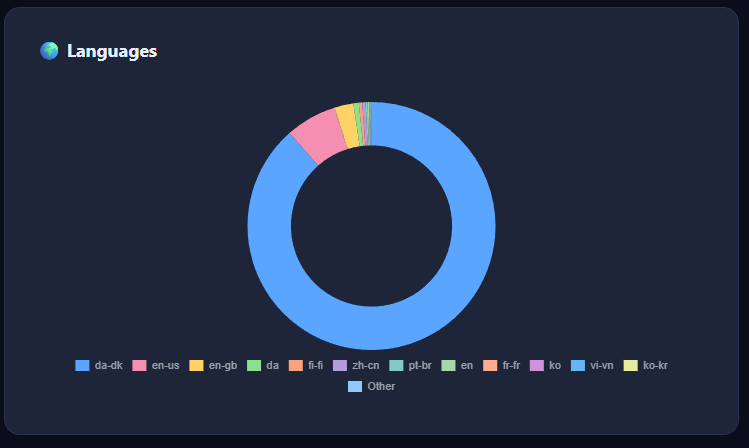
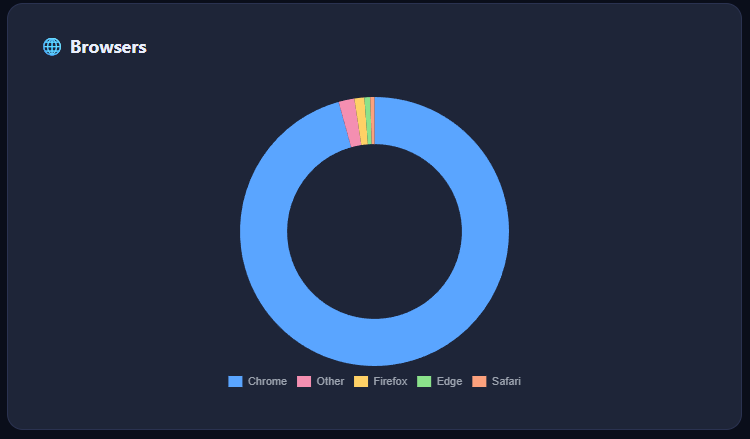
5) Audience insights (without profiling)
Abstracts shows technical context — not behavioral profiles. Useful for compatibility decisions and prioritizing platforms.
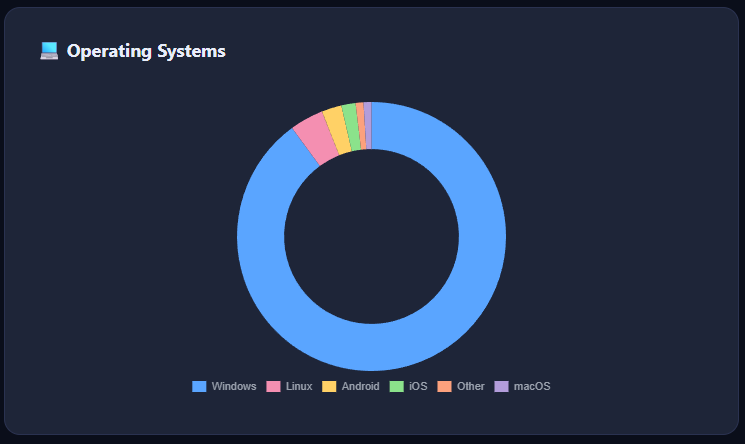
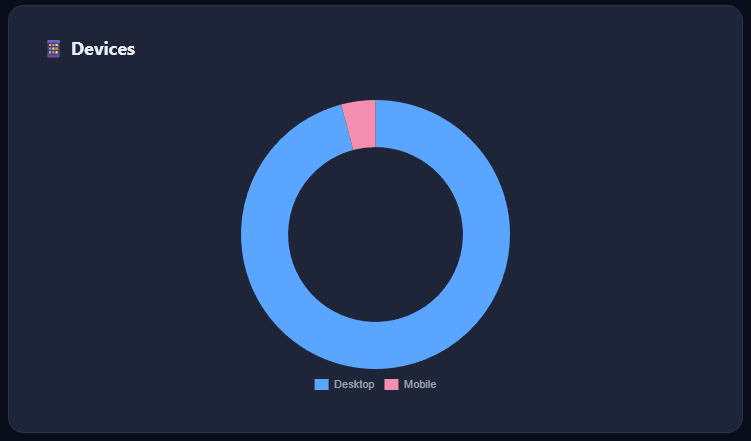
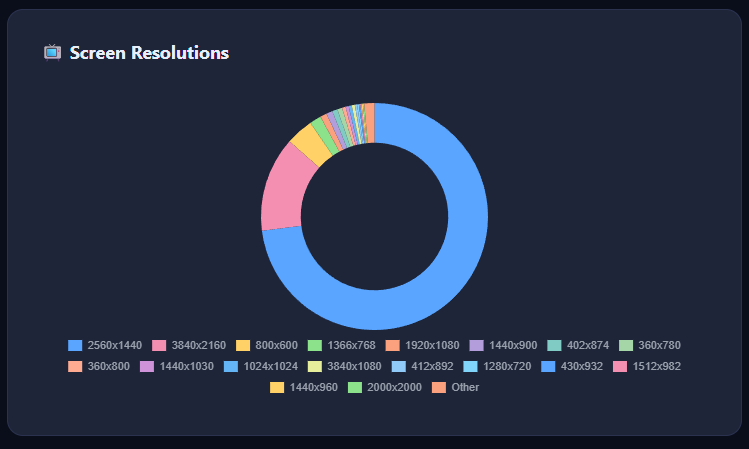
6) Devices & screen resolutions
See how people actually view your site (desktop vs mobile) and the screen sizes that matter for layout and UX.
7) Usage credits
Abstracts uses a single transparent credit system:
- 1 pageview = 1 credit
- 1 event = 1 credit
- Pageviews + events share the same monthly pool
Example from your dashboard
In this example, you used 395 pageview credits and 720 event credits. Total usage is 1,115 out of a 50,000/month limit. No hidden multipliers, no “enterprise math”.
8) Event tracking (actions, not surveillance)
Track things like scroll depth, scroll completion, form submissions, and button clicks — anonymously and site-local. Events help you understand what works, not who someone is.
9) How the tracker works (technical overview)
The tracker is a lightweight JS snippet loaded from your analytics domain and sent only to your endpoint. It does not set cookies, fingerprint users, or call third-party services.
It sends:
- Page URL
- Referrer (if present)
- Technical context (browser, OS, resolution, device)
- Short-lived anonymous visitor hash
It does not:
- Set cookies
- Fingerprint users
- Sync IDs across sites
- Share data with ad networks
10) Why it’s better than conventional big-tech analytics
Big-tech analytics is built for advertising and profiling. Abstracts is built for understanding your site while respecting your users.
| Conventional analytics | Abstracts Analytics |
|---|---|
| Cookies required | No cookies |
| Consent banners often required | Often not required |
| Third-party data flows | First-party only |
| User profiling / remarketing | No profiling |
| Data leaves your control | You control everything |
11) Paid membership is coming
A paid tier is on the way with higher limits and expanded features — while keeping the same privacy-first approach and transparency.